Thursday, July 12, 2012

Quick Tips for Hassle Free Video


Recently, I attended a workshop titled “How to Shoot Video Like a Pro.” The first 45 minutes of the 90 minute workshop discussed how to hire a producer and director, how to find “talent,” and setting up a boom mic and camera dolly.

In most cases when shooting video for technical assistance purposes, you will not need to produce a high quality video, nor have the opportunity to do several “takes.” Here are some basic tips I have found helpful to increase my chances of getting it right the first time.

Lighting
I always try to be aware of my light source. Light originating behind my subject will make them too dark.

Sound
I test the sound in the room by standing at a distance and walking toward the camcorder, while it is recording, and reciting a passage at a constant volume. This tells me the best distance for recording and sometimes informs me of background noise I hadn’t noticed.

Camera position
When applicable, I use a tripod to prevent excess movement and I always try to choose an angle that best captures my objectives.

Length of video
Remember, 5 minutes is considered a very long time to watch video. Three minutes or less is ideal. I often times break long videos into vignettes.

Know your camera
I like to keep a crib sheet of the control buttons, for the functions I know I will need.

Be prepared
Making sure the battery is fully charged (including a spare), having extra storage media, and a lens cloth for that inevitable smudge are essential for minimizing surprises.

If you have some favorite tips, please take a moment to share them with the rest of us.

See our brief, Considerations for Creating Video Clips for Technical Assistance  for more detailed guidelines on capturing quality videos.

Posted by Randy Klumph, NCDB

Monday, June 18, 2012

Ways to Use Video to Enhance TA


At NCDB, we have been working with state deaf-blind projects to promote the use of video in technical assistance (TA). While video can be used in a variety of ways, we see the potential for video to empower and engage parents.

Sharing video clips of classroom routines and interactions can be a way to build rapport with parents who may feel disengaged or removed from classroom activities. Video clips offer parents the opportunity to view positive interactions between staff and their child and to present the dynamics of typical classroom practices and activities. In essence, video clips can be a portal through which parents can observe their children in settings that are often hidden from view. Video clips can open new avenues for dialogue, and can empower parents to take a more active role in their child’s daily classroom life.

Let us know your experiences with video and how it has enhanced parents’ roles in their children’s education. Has it impacted family perceptions of schools? Are schools comfortable sharing daily activities with parents via video? How can we use video to build trust and rapport between parents and schools? We’ll use the comments section below to track your comments.
The accompanying brief “Ways to Use Video to Enhance TA” addresses some of the ways projects might use video as part of their TA repertoire.   View the brief.

Posted by Jon Harding, NCDB

Wednesday, March 7, 2012

Apps and Resources for Young Children with Special Needs

Gloria Rodriguez-Gil from CA Deaf-Blind Services reports on her experiences using the iPad with students who are deaf-blind, deaf, and hard of hearing with special needs.

Read post: http://www.cadbs.org/news/gloria-apps-and-resources-for-young-children-with-special-needs/

High Touch and Low Incidence - What I have learned from the Deafblind Census

Jim Durkel from Texas writes about access and support for children who are deaf-blind.


In a conversation I had with Jay Gense, director of the National Consortium on Deaf-Blindness (NCDB), he estimated the incidence of deafblindness for children and youth birth to 22 years old in the United States is around .01%.
The incidence in Texas is slightly higher at about .017%.  This means that out of the 4 million plus students in public education in Texas, around 750 are identified as having both hearing and vision problems.  More

Thursday, February 16, 2012

Distance Mentorship Project and the "New Normal"

Jon Harding, NCDB


The phrase “new normal” is uttered a lot these days, and we worry what it actually means for those of us who work in the Deaf-Blind Technical Assistance network.  The “new normal” is often used to describe ongoing changes in our culture, our economy, and our political systems, but it can also apply to our small corner of the world, too.  For state deaf-blind projects and NCDB 2.0, operating in the “new normal” means that while we continue to strive to improve outcomes for children and their families,  ongoing changes often affect our level of resource.  We find ourselves having to do more or do different with less money, time, and/or staff. However, this is also an opportunity to reassess how we allocate our resources and to clarify our mission.  The values that underpin our TA behaviors and practices as TA providers (relationships, communication, self-determination, personal growth, education, respect, choice, inclusion, empowerment, and self-fulfillment) should not change.  The debate is not what we want to achieve but, rather, how to achieve it.  Technology can be the vehicle to produce child and family outcomes in a more efficient way.  

The “Old Way”:
While State Deaf-Blind Technical Assistance Projects are diverse, they have traditionally used a model of TA that relies heavily on in-person trainings, workshops, and conferences to create change and build the capacity of “systems” to serve the needs of our children and families (and honor our core values).  These trainings typically consist of training materials, videos, assessments, and/or curriculum that are shared by a speaker, facilitator, and/or recognized ‘expert’ from the field.  Participants are typically teachers, paraprofessionals, related service providers, family members, administrators, etc.  In this context, projects expect and hope that workshop participants implement the strategies and practices with individual children and families that are being extolled in the workshops.  

Most projects, too, have some element of on-site or one-to-one technical assistance as part of their repertoire.  Some projects contract with outreach consultants who have been trained in some elements of deaf-blindness.  The consultants might serve a geographic region or neighboring school districts.  Often project employees serve as consultants who confer with teachers and/or teams by phone or on-site. 

“Old Way” challenges:
  • Implementation and measuring change:
Projects need to demonstrate accountability for their efforts by collecting and reporting impact data (ie:  what changed as a result of our efforts?).  However, measuring changes in behavior subsequent to workshops, sporadic on-site visits, or episodic phone consults has been problematic.  Projects rely on self-reporting and perception to measure behavioral changes in either the service provider or the child.  Documenting behavior change over a period of time (weeks, months, or even years) is an even bigger challenge.  Modeling, checking for understanding, and guided practice (Madeline Hunter concepts) are typically absent in this traditional model of TA.
  • On going support:
Even highly trained, experienced, and motivated teachers need support when working with children who are complex.  Unfortunately, most teachers and providers working with children who are deaf-blind receive little or no training before being hired or prior to a child being placed in his/her class.  Attending a one or two-day workshop is often a respite and certainly can provide relevant information, but it is unlikely to induce changes in teaching behavior.  In the same way, even the most highly skilled consultant will find it difficult to compel changes in behavior as a result of infrequent one-to-one contacts. 
  • Building capacity:
Good TA providers know the answers to the challenges presented by children with complex needs are most likely to be solved by the team members themselves.  While almost every school serving a child who is deaf-blind embraces the “teaming” concept, what we often find is confusion, indecision, uncoordinated services, and a lack of communication among the different specialty staff.   Adding a deaf-blind project consultant to the mix on a one-time or intermittent basis rarely solves this dilemma and can, in fact, exacerbate any confusion team members feel.
  • Cost:
By almost any measure, on-site technical assistance is expensive.  Travel costs typically involve paying for transportation, food, and sometimes lodging.  Few would advocate eliminating on-site TA entirely, for there are clear benefits to meeting in person.  Project staff will have to assess the cost/benefit of all TA activities in the context of their budgets, but we must acknowledge the costs for on-site TA are unlikely to fall.  

One “New Way”
The Distance Mentorship Program (DMP) was developed in response to the challenges mentioned above.  The model has been described in the Deaf-Blind Perspectives article, Making Online TechnicalAssistance Connections .  While it can be argued that using the DMP model can reduce costs, it may not be the most important reason to use it.  Perhaps the most compelling reason to adopt a model that allows TA to be delivered remotely is that it can increase communication within the local team and with consultants over an extensive period of time.  Ultimately, the implementation of strategies that are documented, and the resulting changes in behaviors can become the foundation for the local team to extend and increase their skills with other students and in other environments.  An online, permanent electronic repository of videos, resources, and conversations can be shared with other professionals as the child transitions to new settings.  

The DMP allows consultants to meet regularly with providers and to engage in the struggles that present themselves throughout a school year.  Providers often appreciate the freedom to adapt their strategies, to acknowledge their fears, and to try “fun” activities that may not have an obvious connection to state standards, assessment measures, or standard grade-level curriculum.  Consultants and providers can build a relationship based on trust and respect in ways that is impossible with episodic or one-time on-site visits.

It is important to state that the DMP is simply one model that can be utilized to deliver intensive, specific TA targeting both service provider changes as well as child and family outcomes.  This model can and should be seen as a compliment to other systemic efforts that attempt to build capacity and improve outcomes:  personnel preparation, intervener training, research, and effective TA systems. 

The “new normal” demands new, innovative ways to deliver services that result in improved child and family outcomes, but also align with our larger values and principles.  The Distance Mentorship model is one way to alleviate our fears about the “new normal”. 

Tuesday, February 7, 2012

Jan van Dijk's Child-Centered Assessment

Gloria Rodgriguez-Gil from CA Deaf-Blind Services reports on van Dijk's presentation at the 16th Annual Lowenfeld-Akeson Early Years Symposium.  He spoke on his assessment approach with children with multiple disabilities.

Wednesday, September 28, 2011

Using the Deaf-Blind Child Count Maps and Pivot Tables Together

Posted by Mark Schalock  - NCDB

As we post the Deaf-Blind Child Count for 2010, it seems a good time to revisit the tools available through NCDB to delve deeper into the Child Count data.  A year ago, in June 2010, NCDB hosted a webinar on the newly created Child Count Data Maps and the updated Pivot Tables/Charts.[1] This blog entry is intended to provide some ideas and strategies on how to use the tools in concert to maximize each tool’s capabilities.

Each tool has different strengths that can easily be exploited to provide you with very specific information.  The Data Maps are perfect for seeing the big picture and identifying states with similar characteristics. The Pivot Charts/Tables are better suited to delving down in to the data to find specific patterns.

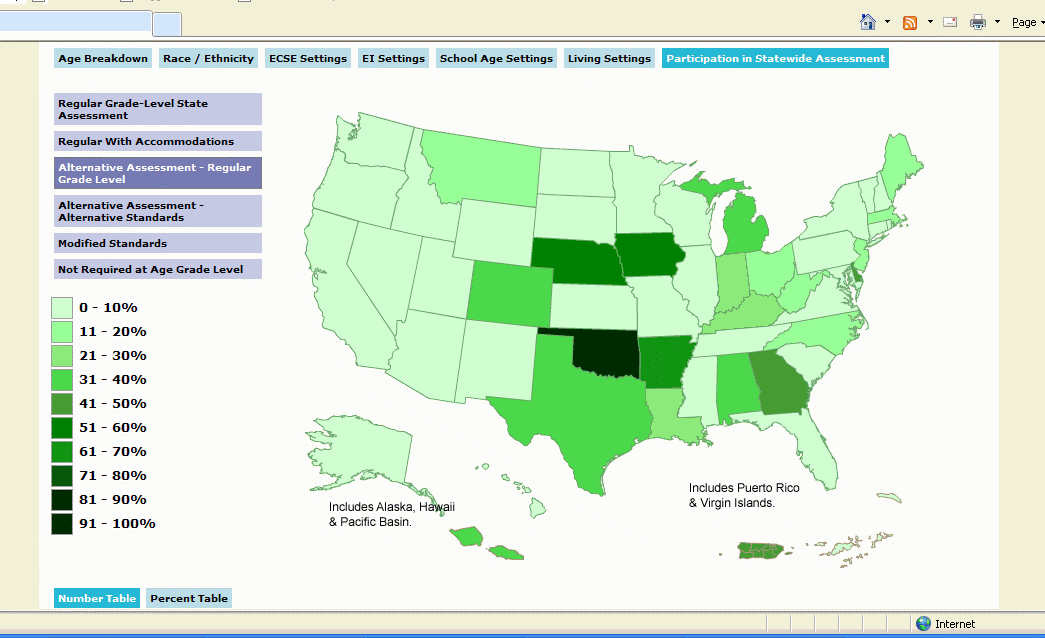
For example, you are in Nebraska and are interested in providing professional development on administering alternative assessments tied to regular grade level standards. You might was to identify other states that have similar patterns of children taking regular grade level alternative state assessments to talk with your colleagues about what they have done in this area. To do this, you can select this option on the data mapping tool and see which other states are similar. The map below shows that there are a number of other states in the region that have a similar pattern: Iowa, Colorado, Oklahoma, and Arkansas. Using the data map provides a quick, visual summary of this query.


[1] An archived version of this webinar can be accessed at: http://www.nationaldb.org/NCDBProducts.php?prodID=121


Switching now to the Pivot Tables/Charts, you can select just these states to conduct additional analyses around state assessments. For example, you are especially interested in the professional development targeting middle school and high school age students. You also want to know whether educational placement is in any way related to type of assessment. In Excel 2007, you can select just those states, age ranges and type of assessment by filtering each of these variables.

To select specific states, click on State in the Pivot Table Field List (see below), un-click “all” and then check those states you want to include. Next, select State Assessment and select the option of alternative assessment regular grade level standards. Finally, select Age Group and select the school age groups of “6-11”, “12-17” and “18-21.” You now can compare yourself to your neighbor states. You will see that like most of the states, the largest group of children/youth taking alterative assessments tied to regular grade level standards is in middle and high school. Arkansas is the exception, where the largest group is at the elementary level. Thus, contacting Colorado, Iowa and Oklahoma would be indicated.


To see whether these is a difference by educational setting, move Age Group and State Assessment back up into the Pivot Table Field List pane and move Educational Setting into the Legend Field pane after selecting just the school age settings (see below). You will notice that the age group and state assessment filters will remain in effect.

As expected, the largest group of children/youth in school age special education taking alternative assessments tied to regular grade level standards, is in regular classrooms less than 40% of the day. This is expected because this is the most common overall education setting. However, Oklahoma and Arkansas are the only other states with children/youth in Homebound/Hospital settings who are taking alternative assessment tied to regular grade level standards. You might want to contact colleagues in these states if a Homebound/Hospital setting is important.


This example is simply designed to show how you can use both the Data Mapping tool and the Pivot Table/Charts together to address any number of questions or issues.

You can access the Data Maps at: http://www.nationaldb.org/censusMaps.php

If you have not already downloaded the Pivot Tables/Charts, please contact us and we will provide the information needed to do so.

For more information or help, please contact Mark Schalock at schalom@wou.edu
Or at (503) 838-8777.